
Businesswoman working in empty office
gettyThe weekly "low" new unemployment numbers draw yawns these days. Gone are those omens from the $600 bonus payment end. July's 10-1/2% unemployment rate was down 4% from only three months ago, and August's number undoubtedly will be in the single digits. And, most importantly, the stock market is going gangbusters. So, let's move on.
No, let's not. Let's revisit the unemployment data – all the data, not just the one number that the media focused on: "seasonally adjusted initial unemployment claims."
Note: In my previous articles about unemployment, my purpose was to counter the high negativity being supported by the ~50 million cumulative initial claims the media was stressing. I discussed the overlooked good news - the ~15 million continued claims meant that ~35 million had left unemployment. Now, however, we must look at the data to offset the diminished interest in the remaining ~14 million unemployed, still filing continued claims.
The two key items to examine are:
- Continued unemployment claims
- Duration of unemployment
First - Continued unemployment claims: The missing analysis
These are the required weekly filings for those that were still unemployed for the week. This measure, compared to the cumulative initial claim filings, shows the proportion of unemployed that remain, even as time moves on.
I believe the best approach to understanding the data is to examine a series of graphs. But, first, a word about seasonally adjusted (SA) data. These are used in normal times because seasonal hiring and firing cycles similarly each year. The purpose is to allow comparison across the seasons. However, in extraordinary times like these, those seasonal influences are overwhelmed by the abnormal forces. Therefore, the data to examine are the "non-seasonally adjusted" (NSA) numbers, otherwise known as the "actual" data. For example, here are the last four weeks of NSA and SA initial claim filings:
Initial claim filings (in thousands)
Week Actual (NSA) Adjusted (SA)
8-01 988 1,191
8-08 839 971
8-15 890 1,104
8-22 822 1,006
So, the three weekly headlines of "still over 1 million" were false. Moreover, the seasonal adjustment created a non-existent ~800 thousand filers – almost one week's worth of actual filers. The reason the differences are so large is that we are in the summer period when unemployment fillings are normally low. Therefore, the seasonal adjustments have inflated the 2020’s abnormally high, actual numbers by ~20%, as shown in this graph:
Graph #1 – Seasonal adjustment factors
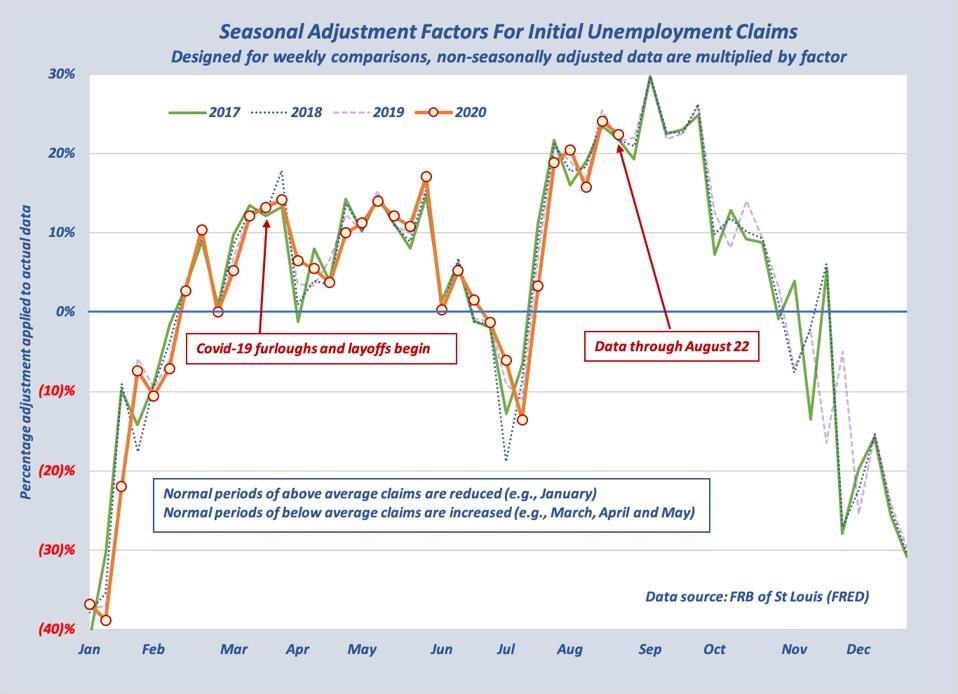
Seasonal adjustment factors for initial unemployment claims
John Tobey (FRB of St Louis - FRED)Now let's walk through the data graphs:
Graph #2 – Cumulative initial claims filed
These data were the source of angst and negative headlines. They certainly were fast-growing, huge numbers, although seasonal adjustment inflated the already sizeable numbers by a non-existent 4-1/2 million.
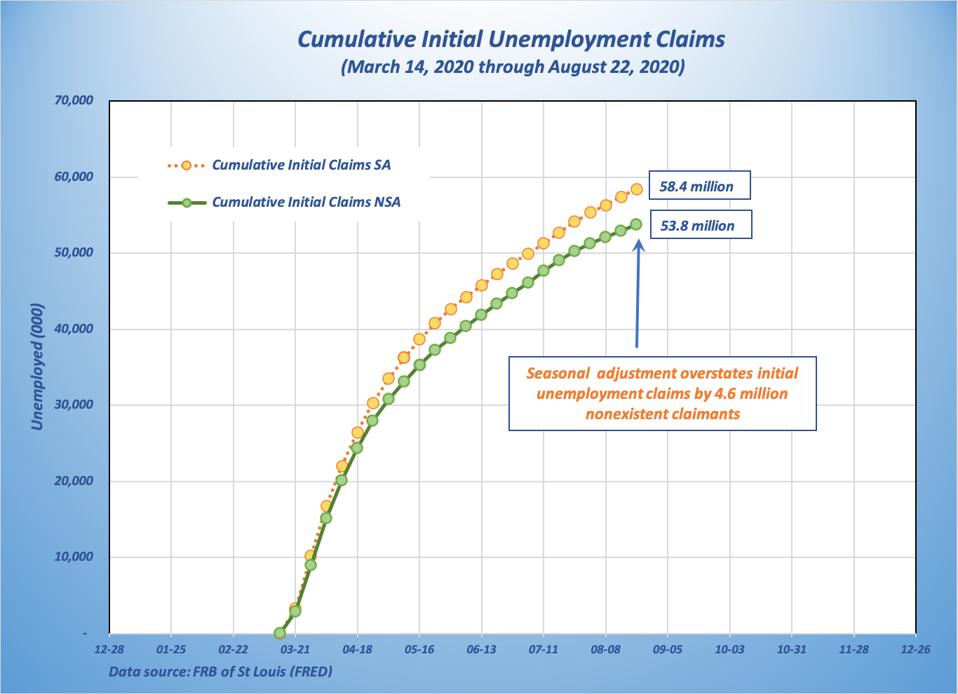
Cumulative initial unemployment claims NSA and SA
John Tobey (FRB of St Louis - FRED)Graph #3 – Total initial plus continued claims filed
Here we bring in the continued claims filings. Adding those remaining to those filing their initial claims gives us the total unemployed receiving benefits for the week. Why didn't the media ever show these important numbers? Because the continued claims count was in the next week's report.
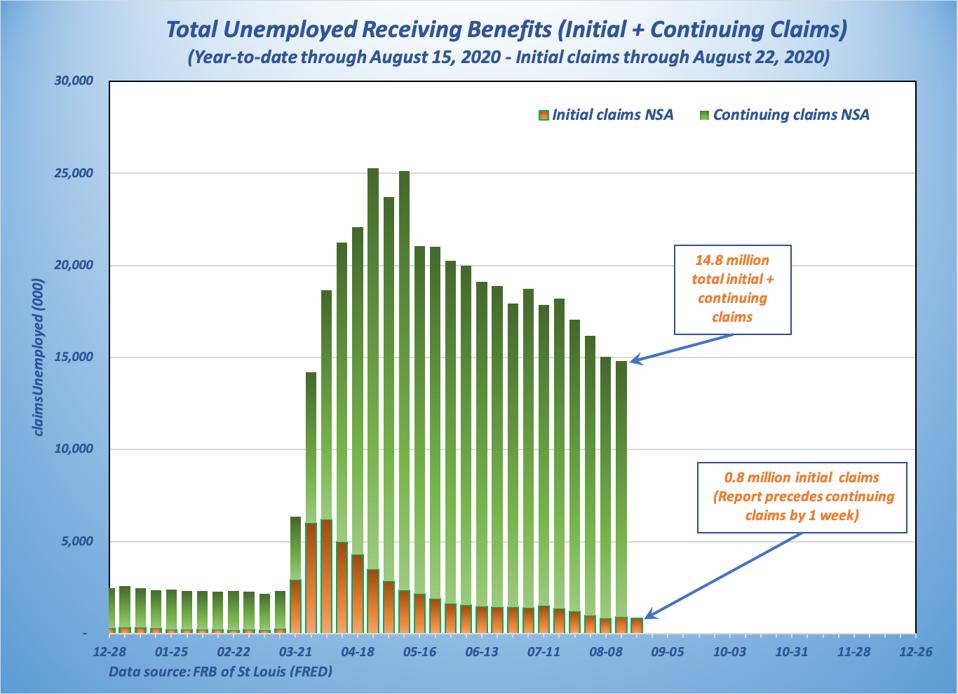
Total unemployed receiving benefits
John Tobey (FRB of St Louis - FRED)Graph #4 – Cumulative initial claims vs. continued claims
Now we can make use of those large cumulative initial claims numbers to show the sizeable number of people who have left unemployment status.
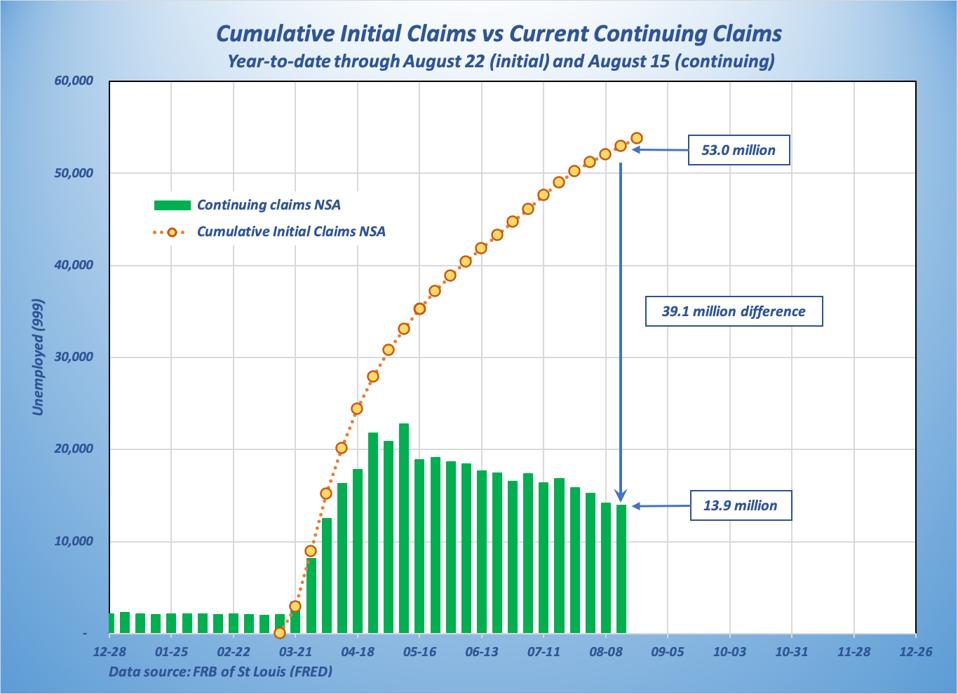
Cumulative initial unemployment claims vs continuing claims
John Tobey (FRB of St Louis - FRED)Second - Duration of unemployment is the key measure
If most people move on within the first three months following becoming unemployed, that is good news. Firing, hiring and transitioning to new jobs is an ongoing and healthy process. However, once many people become unemployed more than three months, it can indicate a weak labor market – even more so once unemployment extends beyond six months.
These data are not dependent on unemployment benefit filings because those can run out or people might not qualify. The U.S. Bureau of Labor Statistics conducts a mid-month survey to gather complete statistics on employment and unemployment. One set of data is unemployment duration, and these are now showing that the current unemployment situation has begun to get serious.
Note: I decided to show the data from January 2005 because the comparisons with the Great Recession are important for understanding both the levels we are seeing and the differences in the dynamics.
Graph #1 – Number of unemployed for 1 to 14 weeks
The dramatic jump in unemployed from mid-March to mid-April is clear. Then, from the April high of ~21 million, the numbers declined over the next three months to ~9 million in mid-July. (One additional point to note are the normal seasonal fluctuations that clearly show up in this graph. For longer unemployment periods, seasonality disappears because other factors are at work.)
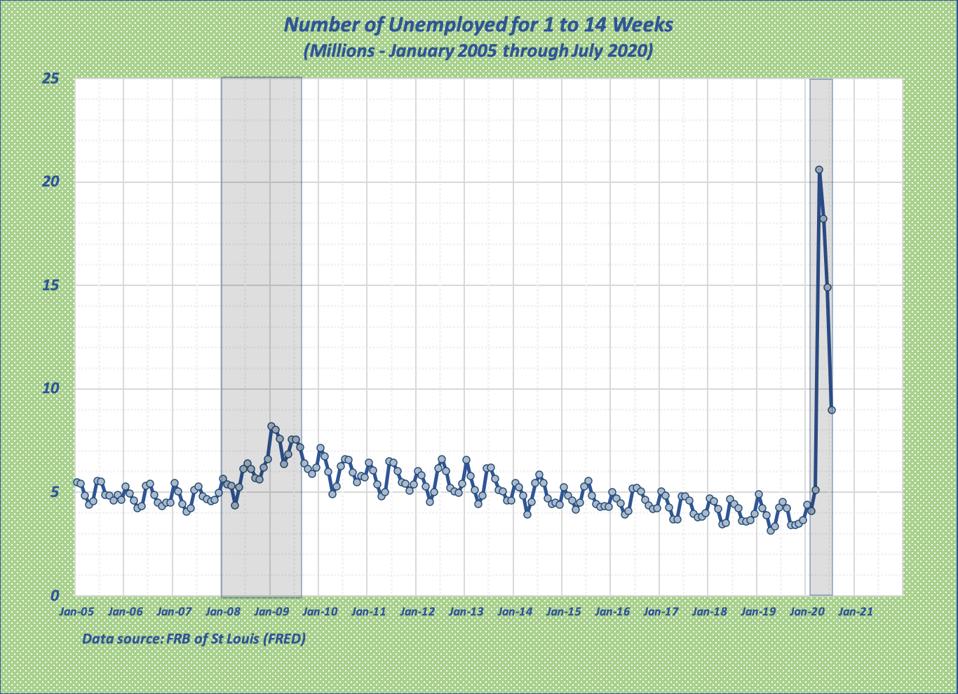
Number of unemployed - 1 to 14 weeks
John Tobey (FRB of St Louis - FRED)However, mid-July was over 14 weeks past the initial layoffs, so a large part of the decline above was caused by a shift to the next, longer duration period.
Graph #2 - Number of unemployed for 15 to 26 weeks and 27+ weeks
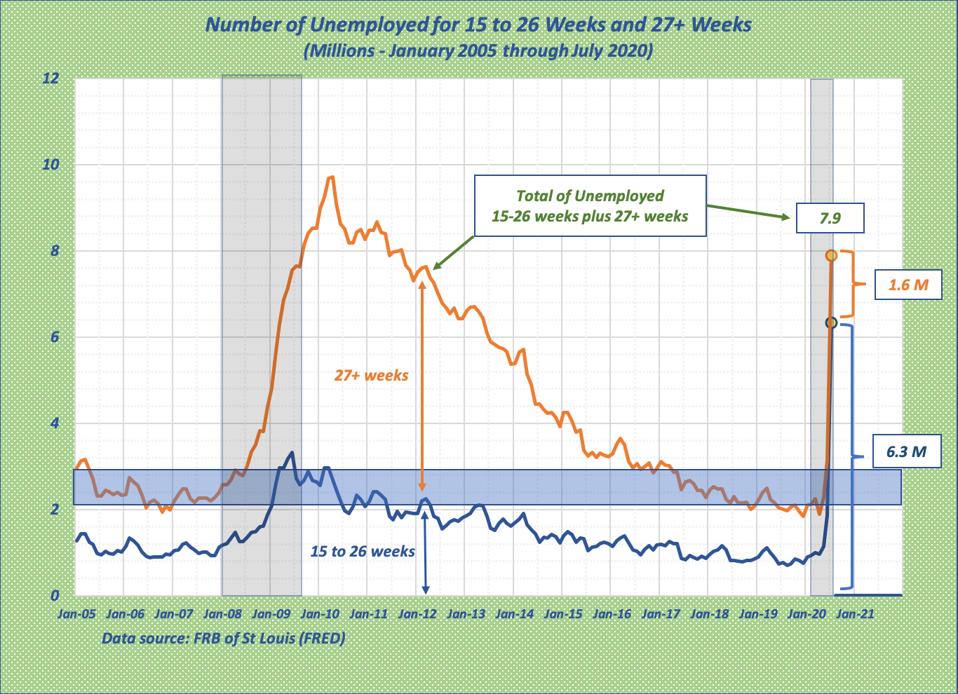
Number of unemployed - 15 to 26 weeks, and 27+ weeks
John Tobey (FRB of St Louis - FRED)Here we arrive at the key graph. These are the unemployment periods that can reveal weakness in the economic growth and business success, as well as financial challenges, consumer pullbacks and social concerns.
Although the current ~8 million total is comparable to the Great Recession's high, the composition is less serious. Most continued unemployed have just moved into the low end of the 15-26 weeks grouping. In 2009/10, most had reached the 27+ weeks category.
But time moves on. The next visible shift will be in the mid-October survey results, when the remaining early wave people cross the 27-week line. Those results won't be available until the mid-November report release, but the continued unemployment claims could give us some insight into what they might be like.
The bottom line
Unemployment remains an important measure of economic health and improvement. To understand and track conditions, we need to go beyond the media reports that focus on one number or, worse, ignore the issue.
The Link LonkSeptember 01, 2020 at 10:36AM
https://ift.tt/3lLIK0G
Unemployment Is Still At Work - And Time Is Increasing Its Seriousness - Forbes
https://ift.tt/2VuKK1x
Work


No comments:
Post a Comment